Bitterns, in Stereo
I've recently been working on some stereo acoustic data recorded at a lagoon in the highlands. The location was previously found to be hosting Australasian Bitterns and was used during the pilot phase of the CallTrackers citizen science project. The landholders kindly allowed continued monitoring of the site which has been possible thanks to a long term loan of a BAR-LT recorder from Frontier Labs.
Why?
Monitoring from season to season will make it possible to see if the bittern (or bitterns) are coming back, when they occupy the site and if the population is changing. For good population estimates, the ability to localise the bittern calls is important, so the The BAR-LT is set up to record in stereo.
Stereo for localisation
By cross-correlating the two channels I can get a measurement of direction angle with respect to the imaginary line connecting the two microphones. Thinking about it in 3D, this angle describes a cone with its axis along the line. If we assume that the sound is coming from the ground, a fair assumption for calling bitterns, then there are two possible directions. I placed the recorder at the edge of the lagoon with the microphones aligned along the shoreline, so again I think it's reasonable to assume the lagoon-y sounds are all coming from the front side of the recorder, which resolves the ambiguity.
Results
So bearing all of that in mind, here are some results from the bittern calls. There are occasions when there are call sequences close together in time, or even overlapping, that suggest more than one bittern. The top panel in this figure shows a one minute spectrogram with two bitten call sequences of 4 booms each with a ~5 sec gap between them. The middle panel shows the same thing but just the data with a signal-to-noise ratio grater than 5. The slight difference in frequency between the two sequences, and their close proximity in time suggests two bitterns. However the bottom panel is the clincher. It shows the direction to the high SNR data and there's a clear difference.
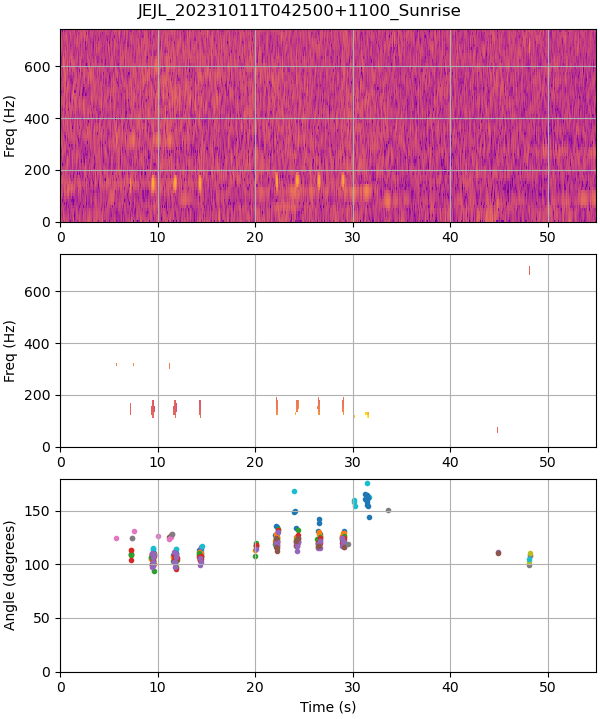
This plot also shows the direction angle in a polar plot, and the difference in angle is a little more apparent.
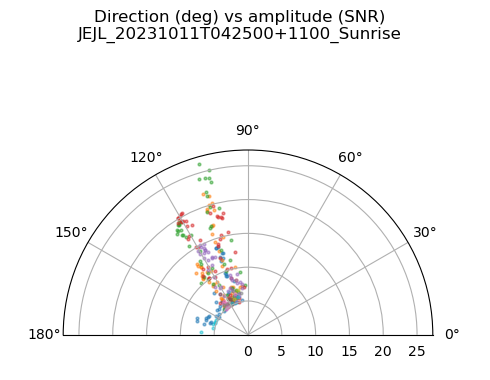
Here are those plots again for a couple of different one minute periods. First one where the call sequences overlap:
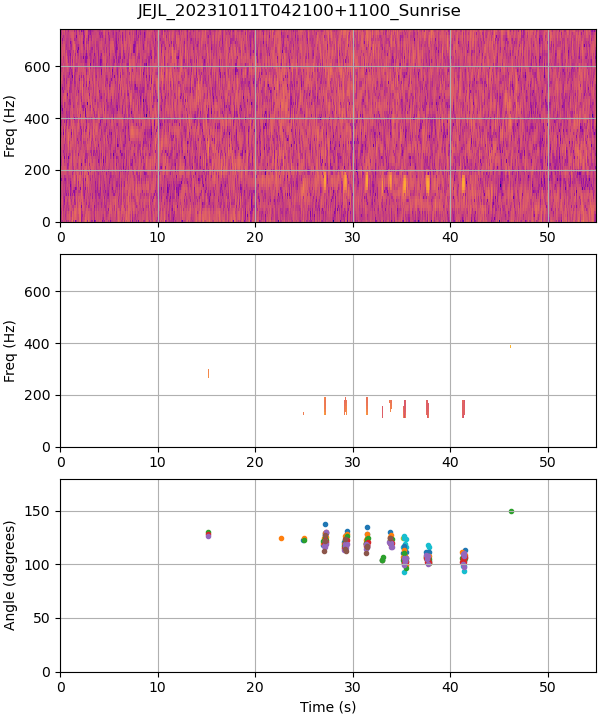
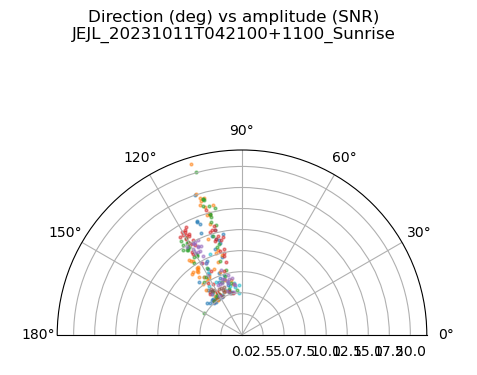
And one where frogs are calling too. This cross-correlation technique does a pretty good job of discriminating them all.
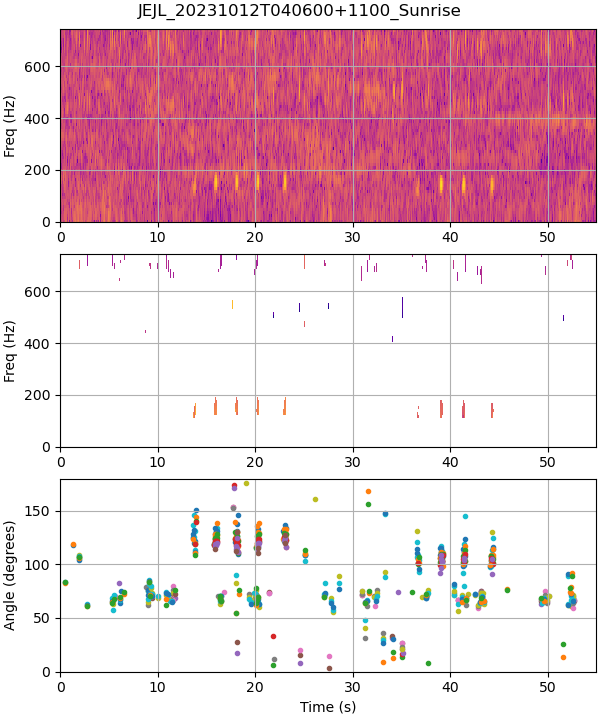
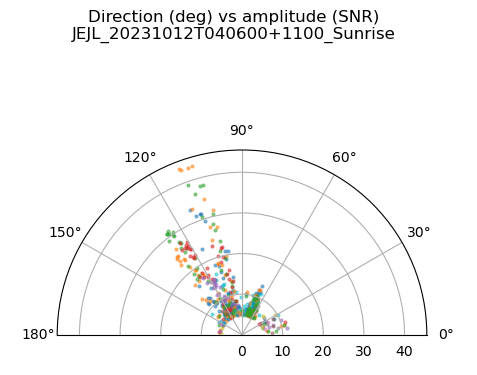
Note that the data shown here were taken a day later and one of the bitterns appears to have moved.