Signal Directions
Last time I showed some results from test data aimed at finding out how well directions can be determined using the cross-correlation technique. I’m now going to look at some real data and see how well it does, and for that I’m using a couple of observations made back in January. The first is of a wattle bird and the second is a bat.
Bird data
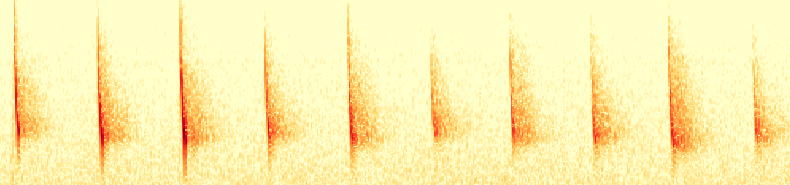
So firstly, here’s the bird: a little wattlebird (Anthochaera chrysoptera). It’s a pretty noisy one and had a broad audio spectrum, so is a nice test case. At the time of recording, the bird was just sitting in a tree and not moving. Here’s a plot that summarises the data:
A little wattlebird (Anthochaera chrysoptera), observed on 10 Jan 2019. The main panel shows the spectrogram and the white vectors are the measurements of direction to the signal (vector length is related to signal strength). The top two panels show signal strength (measured in signal-to-noise ratio) and direction as a function of time for the frequency of the loudest signal (2.9 kHz, indicated by the horizontal line). The two right panels show SNR and direction as a function of frequency (indicated by the vertical line) at the time of the peak.
The direction measurements all look good and consistent across the frequency range. This is pretty surprising given that the baseline is only 15mm which is 13% of a wavelength at 2.9 kHz (118 mm). The ability to measure position is related to signal strength, so here’s a plot that shows that behaviour for the bird data:
Sensitivity to direction as a function of signal strength for the little wattlebird observation.
The above plot shows that the scatter in direction measurements decreases with increasing signal strength as expected. Even at such a short baseline compared to the wavelength, it’s possible to get angles to about 20 degrees at 3-sigma for strong signals.
Bat data
Next is a bat observation which was a little more challenging to process given the higher frequency and the issue of resolving phase turn ambiguities. Fortunately this wasn’t a problem in this case. Here’s what the data look like after processing:
A long-eared bat (Nyctophilus spp) (I think!) observed on 23 Jan 2019. The main panel shows the spectrogram and the white vectors are the measurements of direction to the signal (vector length is related to signal strength). The top two panels show signal strength (measured in signal-to-noise ratio) and direction as a function of time at 38 kHz (indicated by the horizontal line). The two right panels show SNR and direction as a function of frequency (indicated by the vertical line) at the time of the peak. Note the clear change in direction as the bat flies past!
This is pretty exciting I reckon! The phases clearly show the bat moving from left to right with the angle changing by about 60 degrees over 7 seconds. It looks as though the systematics kick in in delay at about the 10 us peak-to-peak level which at this frequency and a 15mm baseline corresponds to 10 degrees in direction:
Amplitude, phase and delay against frequency for a 0.02 sec sample.